Zenith Tech Summary
About Zenith
Q: The stars don't actually move that fast. What's going on?
A: When you see the real stars outside they're not moving that fast. But they do move, say over the course of hours. And in just 30 seconds, they must move across some tiny sliver of the sky. What if that sliver took up your whole screen?
My goal: zoom in enough so that the amount a star moves in 30 seconds would span the screen. Then we'll actually see the earth turning.
The ZenithTrack window covers a patch of sky the size of a grain of rice, held at arm's length.
A View from space (click to explore a 3D model)
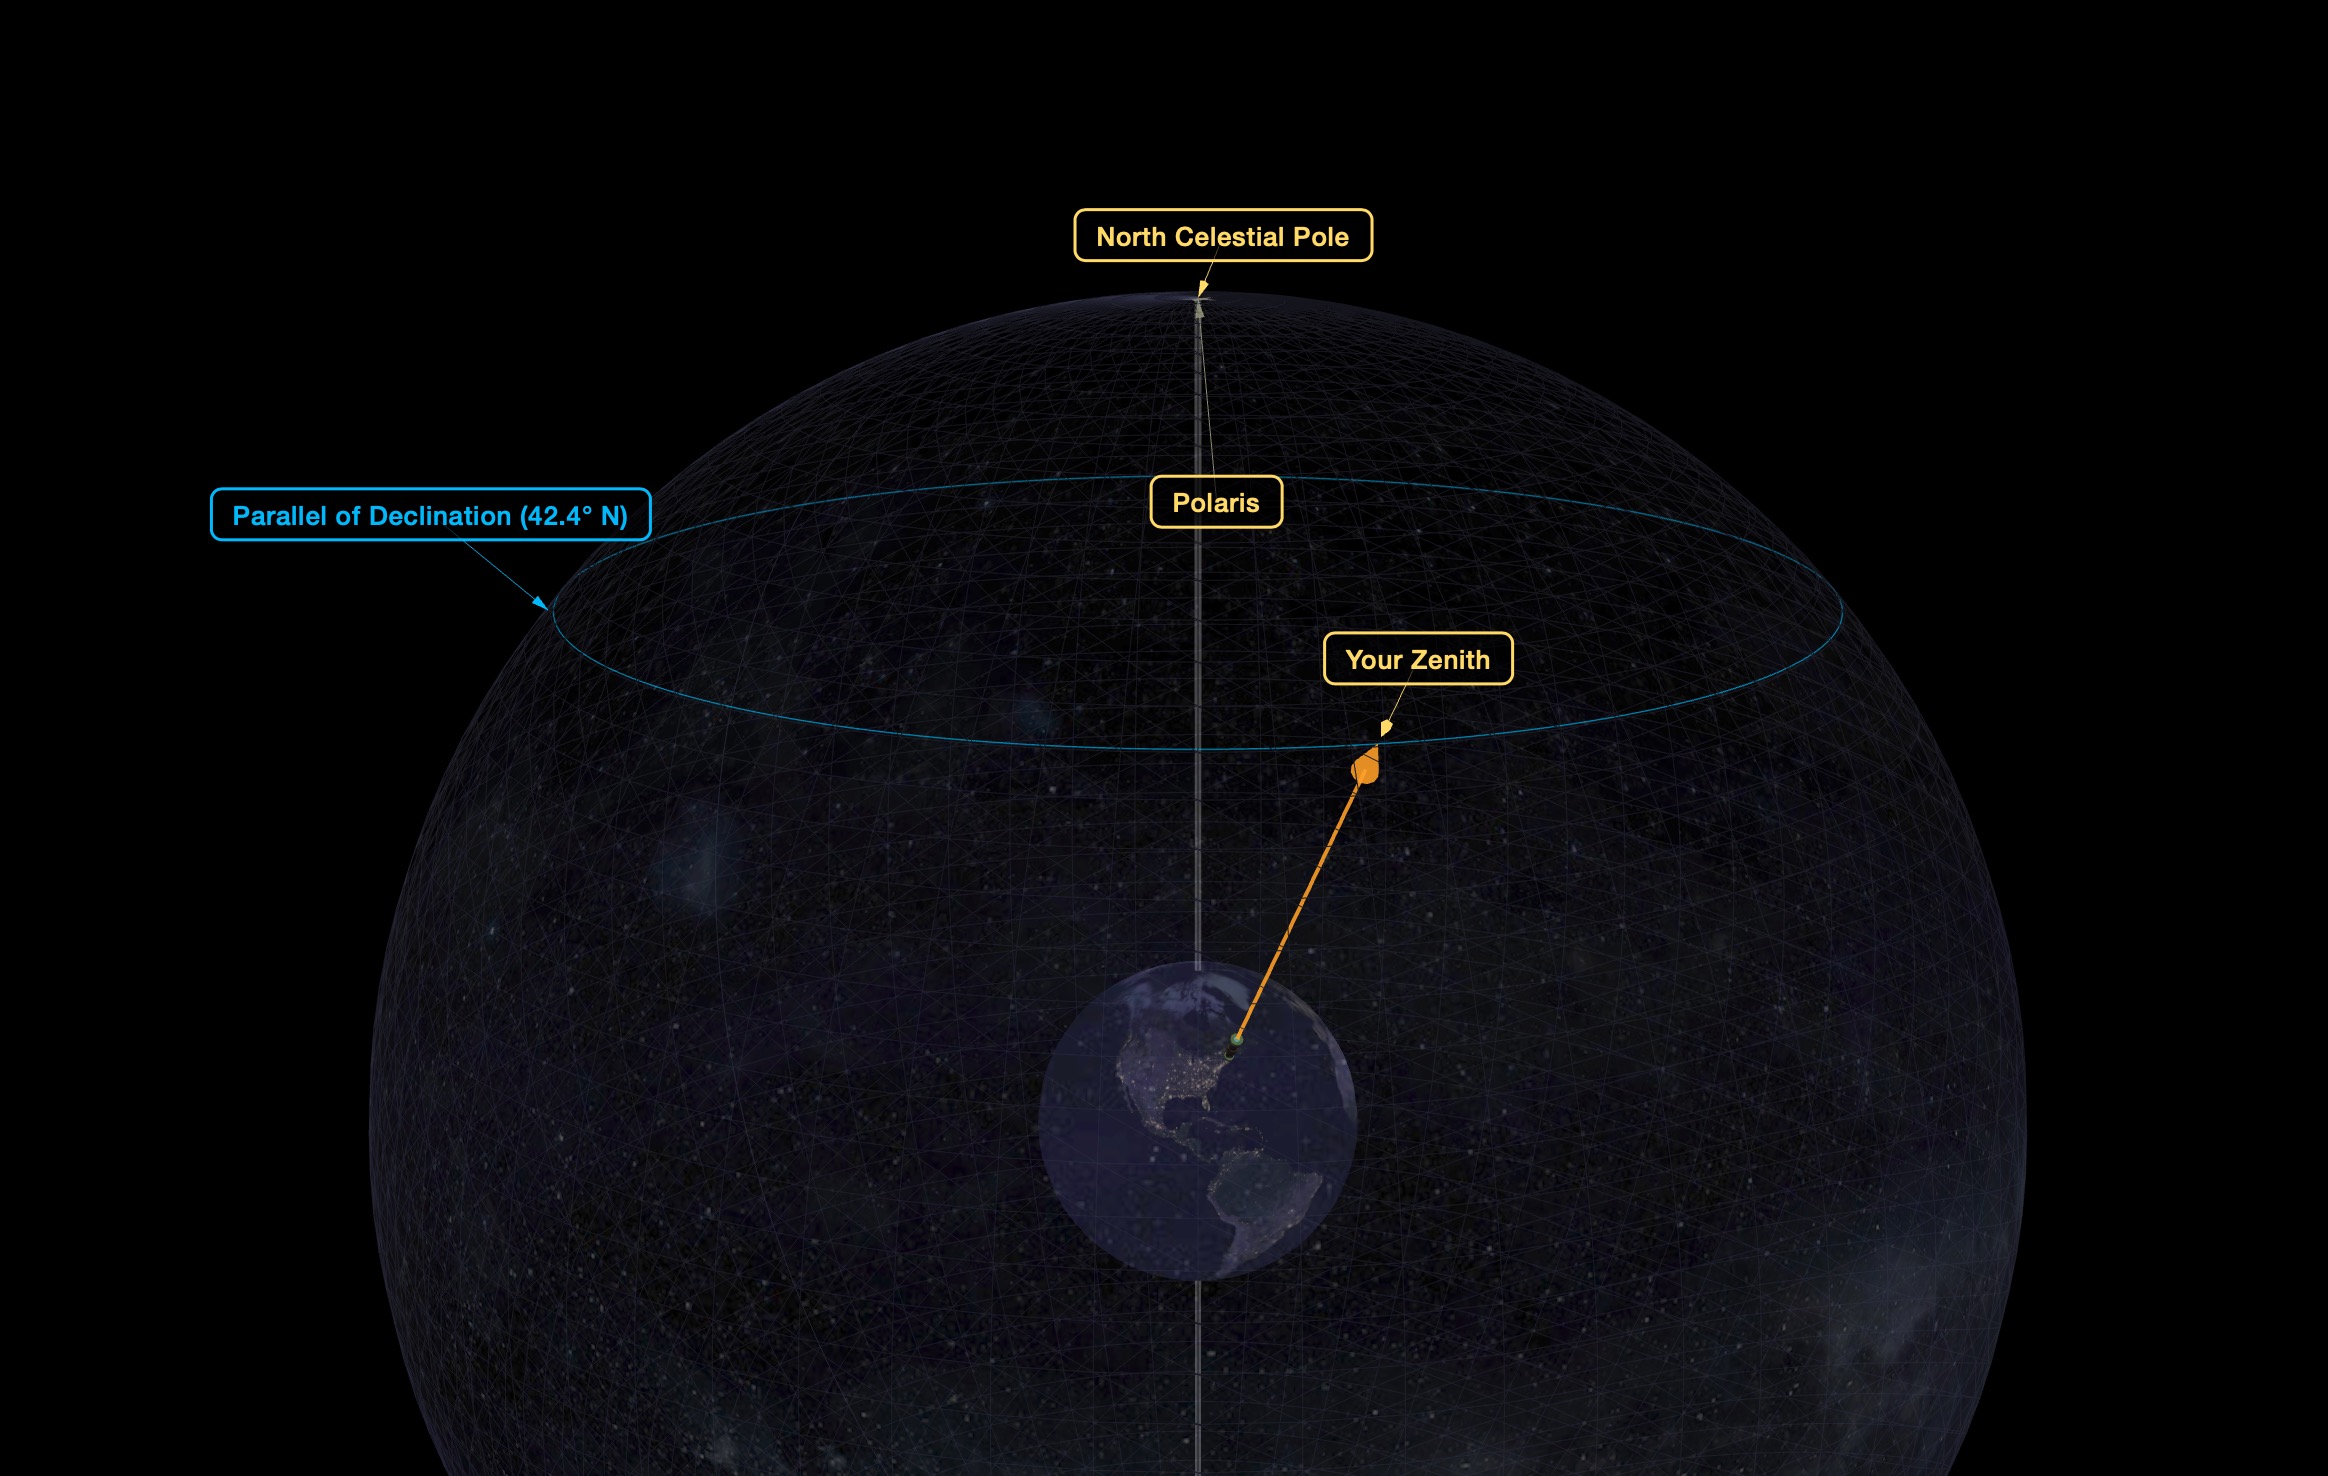
This animation demonstrates earth's rotation and your zenith point sweeping a path across the celestial sphere.
Q: Why did the website request to know my location, and what do you do with that information?
A: It asks in order to show the sky over your particular location. That information never leaves your computer. We (smorgasb.org) never see it. You can decline, and it will default to showing the the view overhead Stonehenge. Depending on your device's settings, the location request itself may be suppressed - ie, your browser may not offer the option of sharing your location.
Q: What are the grid lines?
A: They are the coordinate grid on the “Celestial Globe” (see the interactive model above), and are 0.5 arcminutes per side. Just like latitude & longitude on earth, the RA lines (longitude) get closer, the farther north you go, and the Declination lines (latitude) have a constant height.
About Your Personal Ribbon
ZenithTrack shows a strip of the sky, a thin ribbon, one rice-grain tall, about 2,500 rice-grains long. It repeats every sidereal day, (23 hours 56 minutes). It repeats exactly, and doesn't change with the seasons. You share this view with everyone else on earth at your exact latitude. People due east or west of you get the same movie, but starting at a different time.
This viewport is so slim that it is completely different for someone just 5 miles north or south of you. They get a completely different ribbon.
People north/south of you: different movie
People due east/west of you: same movie, different times
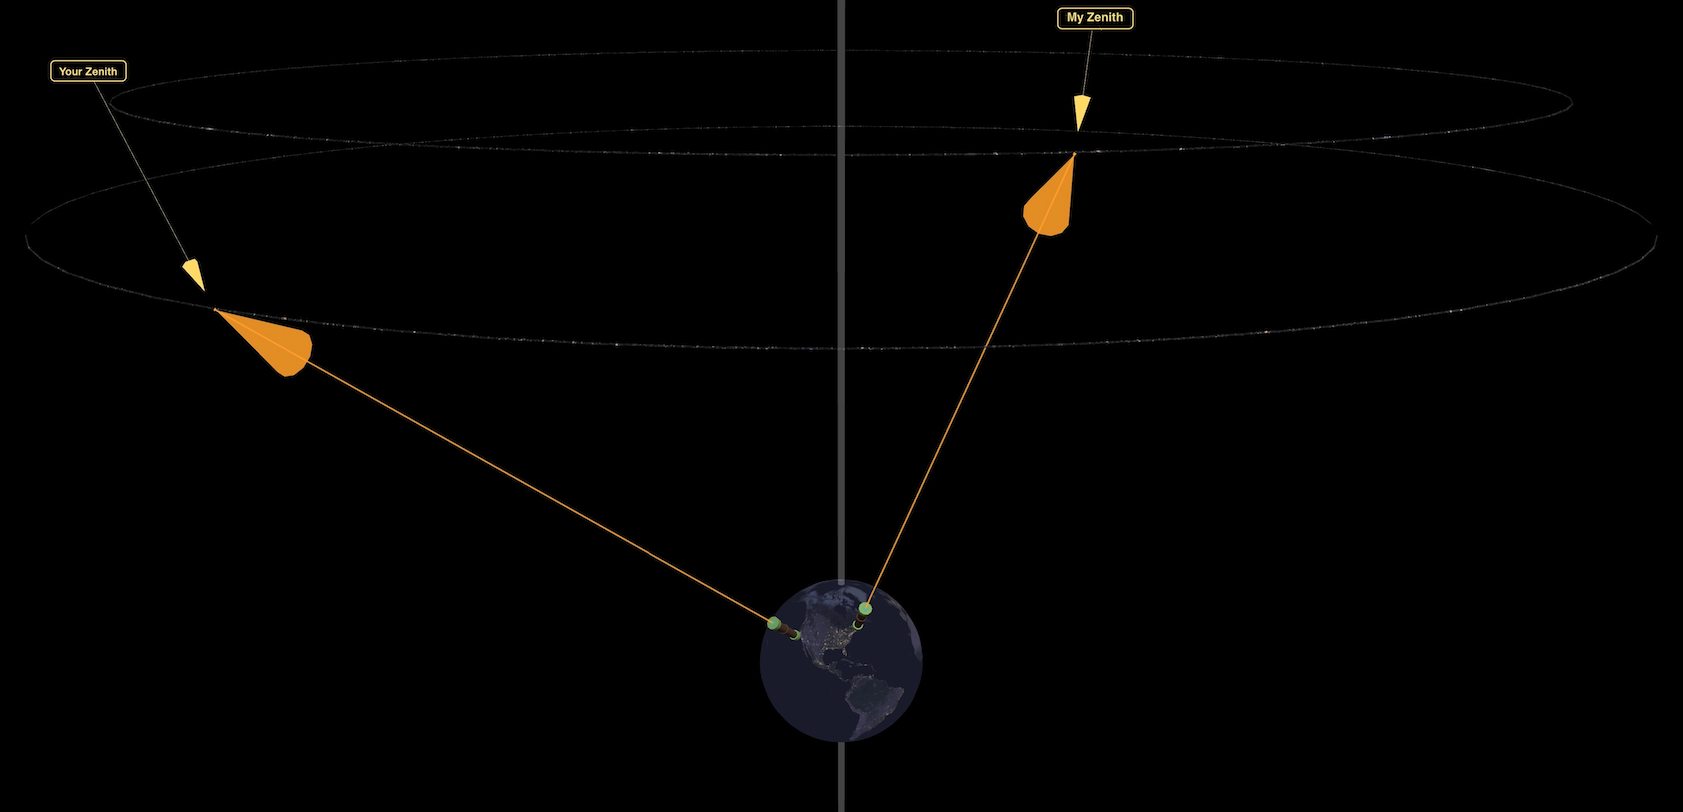
Image Source: Pan-STARRS astronomical survey, data hosted at the MAST archive at Space Telescope Science Institute
Pan-STARRS1 home page
Space Telescope Science Institute
Special thanks to the STScI help desk at for their superb and prompt support!
Making earth’s rotation visible requires a field of view on the order of arcminutes. For a browser window ~1k pixels wide, PanSTARRS meets this critical need with a resolution of 0.26 arcseconds/pixel.
1000px x 0.26”/px = 260” = 4.33’
PanSTARRS makes this observatory feasible with the necessary:
- resolution
- broad sky coverage
- of visible light
That said, it’s not the ideal image set for our purpose. While it has the resolution and coverage, PanSTARRs' primary mission was moving object detection (near-earth asteroids, etc.) and deep field sensitivity, not providing presentable images of known stars. Hence one tradeoff is frequent oversaturation. Any major star blows out the sensor and shows color distortions. See below.
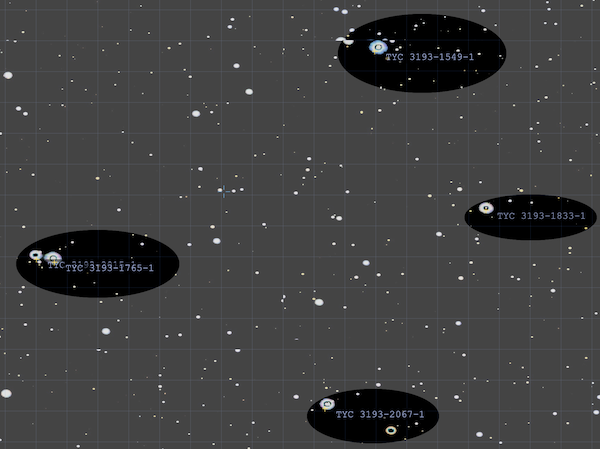
Object names: SIMBAD database
https://simbad.cds.unistra.fr/simbad/
The SIMBAD astronomical database provides basic data, cross-identifications, bibliography and measurements for astronomical objects outside the solar system.
We query SIMBAD for objects based on the current field of view. Zoomed in this deep, it's all obscure. Getting the Horsehead Nebula will be like winning the lottery.
Tiling & Overlays - leaflet.js.
Leaflet is typically used for interactive (Earth) maps. Though the celestial map is a sphere and motion is rotational, at this extreme zoom level, we can treat each tile as a rectangle, and the motion as simply linear. (Which is the same approximation Leaflet uses for navigating on earth). Leaflet handles layering PanSTARRS images, the coordinate grid, and SIMBAD names. Impressively SIMBAD crosshairs align with actual stars in the PanSTARRS images, down to the pixel, while coming from completely independent sources.
Language: Javascript. all client-side, no server component (zero work for daserver :)
Image processing
PanSTARRS raw images are not pretty. We have 2 steps
-
white edge removal - some tiles are incomplete and have white sections along an edge. (if you see narrow white lines on screen, that's a remnant where the white edge removal was too conservative).
-
noise filter - a simple threshold function, with super aggressive settings.
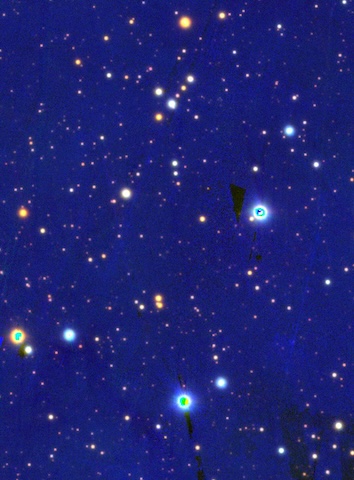
Before:
After:
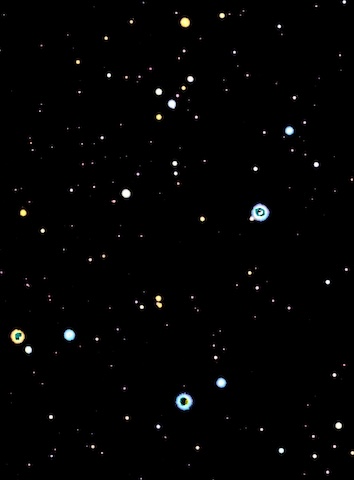
Unsolved problem: oversaturation.
Sensors from this telescope survey oversaturated with even medium brightness stars. See the green blobs in the center of stars in the “before” image, which are then mishandled by the noise filter.
Still working to find a solution. attempts to process near monochromatic pixels (nearly pure green, pure red) and make them white, also drain the color from tiny red stars. Currently exploring topology-based solutions - “green blobs surrounded by white”, etc. such algorithms catch some but not all of the bad pixels, looking like a lazy coloring-book job. We should be able to optimize on the fact that there are no green stars.
Vibe coded in a day with claude.
Installation concept: project on a ceiling
Inspiration:
That first time you looked through a medium power telescope, with no equatorial mount, to see an object drift out of view. Someone, perhaps a teacher, told you "that object didn't move. We did. You're seeing the Earth turning."